

Guides
How to understand Granite Insights
Read your monthly snapshot, six-month trends, category spending, largest expenses, and savings progress without mixing unlike totals.
Insights turn your financial activity into context
Granite Insights helps you step back from individual transactions and see patterns across a month or several months. It brings together a monthly snapshot, income and expense trends, variable spending by category, your largest expenses, and savings and investment activity.
Each panel answers a different question. Some use a selected month, some use a custom snapshot period, and others show a rolling six-month window. Read the title, date range, and definition on each panel before comparing two totals.
Generate a monthly financial snapshot
Choose Generate insights to create a guided summary. You can review last month or choose a custom period of up to 60 days. Granite organizes the selected activity into five parts so you can see where money came from, where it went, and what remained.
- Money in: paycheck income and any outside income included in the snapshot
- Fixed expenses: recurring obligations mapped to your plan
- Variable spending: everyday spending, the leading category, and the largest transaction
- Savings and investments: contributions represented during the period
- Bottom line: income minus fixed expenses, variable spending, savings, and investments
Read the bottom line carefully
The bottom line compares the money represented as coming in with fixed expenses, variable spending, savings, and investments represented in the same snapshot. It can show that you finished ahead, spent more than came in, or approximately broke even.
This is not the same as your bank balance or net worth. A bank balance includes money that may have arrived before the selected period, while net worth also includes assets and debts beyond the transactions summarized here.
Use the six-month chart for direction
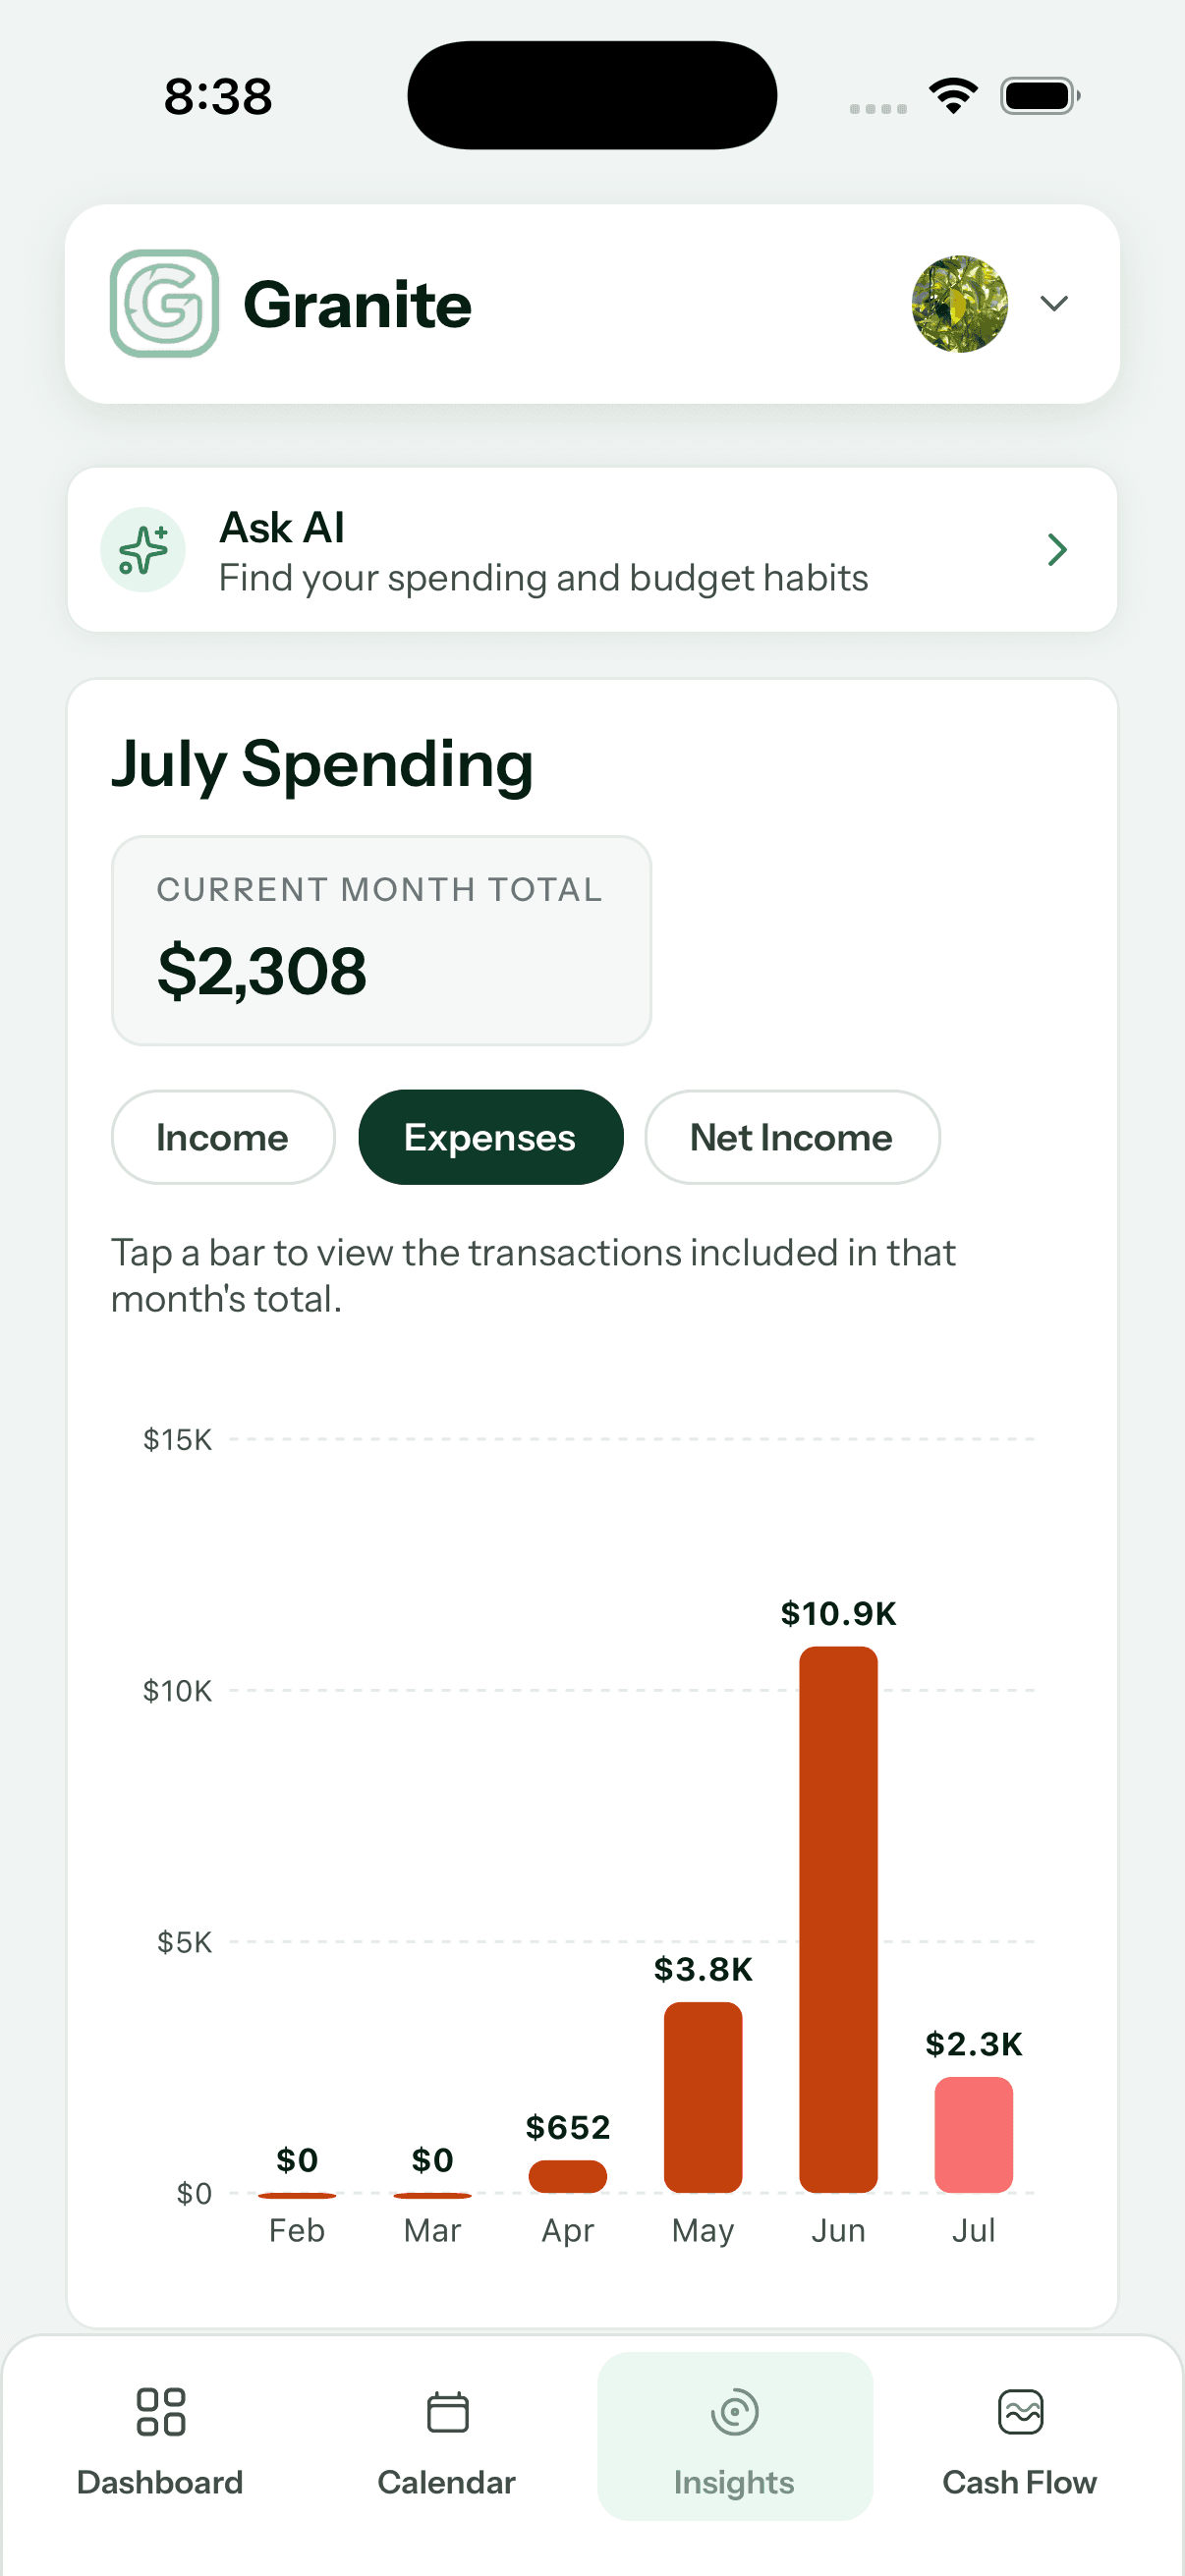
The six-month chart lets you switch among Income, Expenses, and Net Income. Use it to compare recent months, spot a change in direction, and see whether one month is unusually high or low.
Select a bar to inspect the transaction records behind that month. This is often the quickest way to explain a jump before deciding whether anything needs to be corrected.
- Income shows activity Granite identifies as money coming in
- Expenses shows spending represented in the macro view
- Net Income shows the difference between the two for the month
Understand category spending
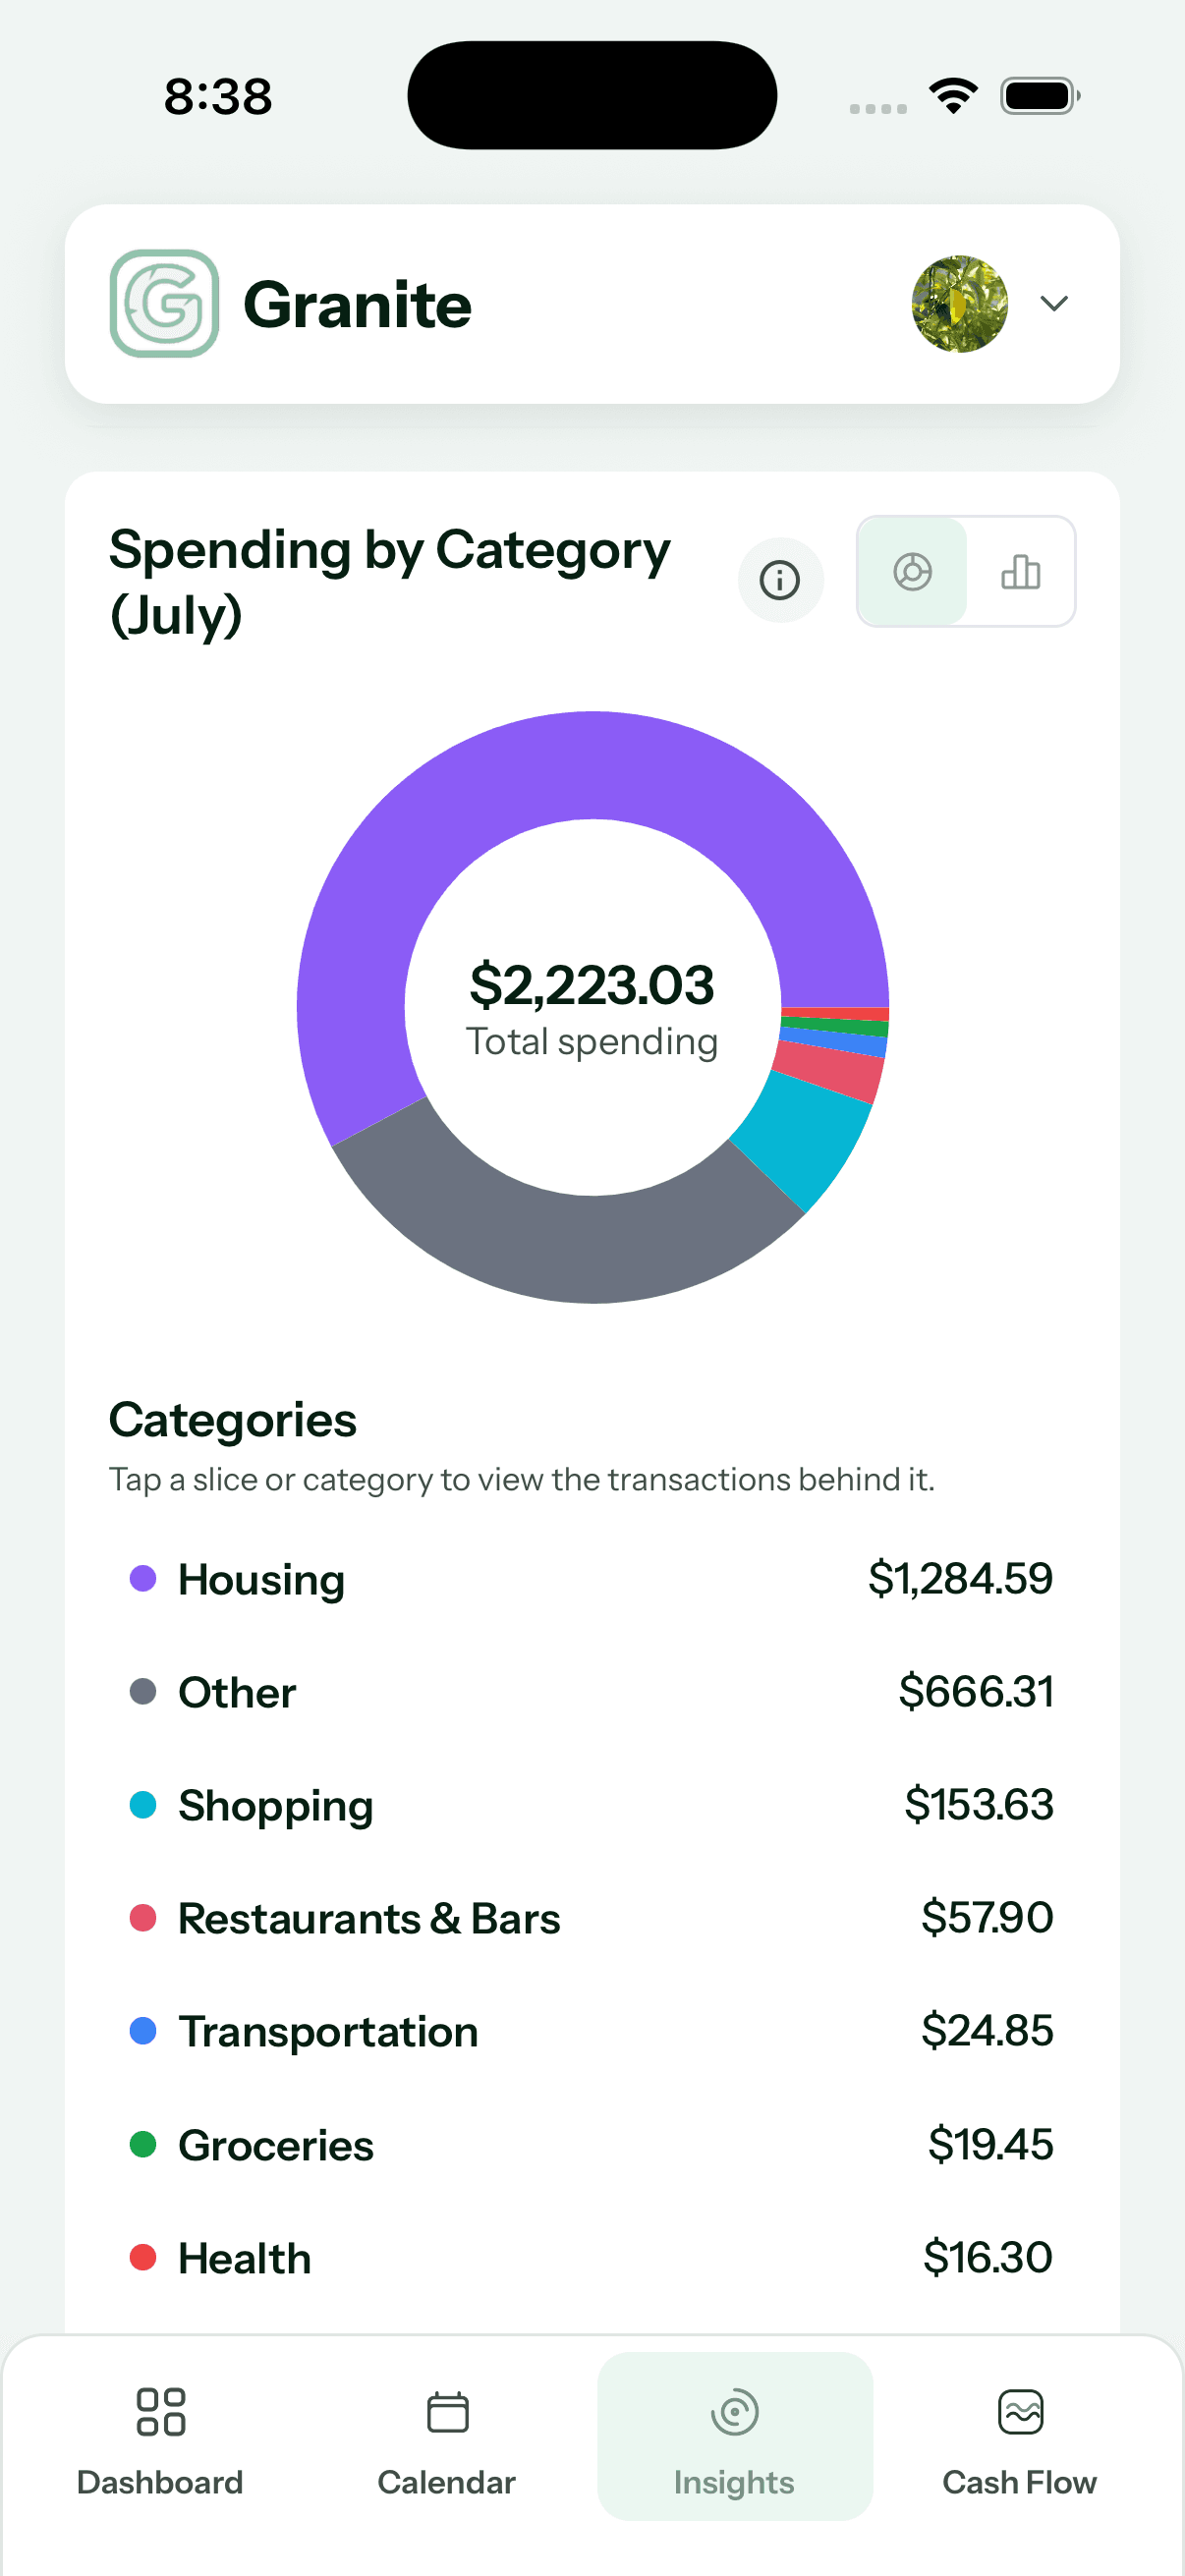
The category chart focuses on variable daily spending for the selected month. Switch between the pie and bar views to compare categories, then select a category to see the transactions included in it.
Because this chart focuses on variable spending, it may not equal a broader expense total that includes recurring bills and subscriptions. The difference does not necessarily indicate an error; the panels may be measuring different kinds of spending.
Review your largest expenses
The Top 5 Largest Expenses panel surfaces the largest eligible expenses in the selected month. Use it to find the few transactions having the greatest effect, then open the related transaction search for more detail.
A large transaction is not automatically a problem. It may be rent, travel, an annual bill, or another planned purchase. The panel is useful because it gives you a short list of items worth recognizing and verifying.
Track savings and investments over six months
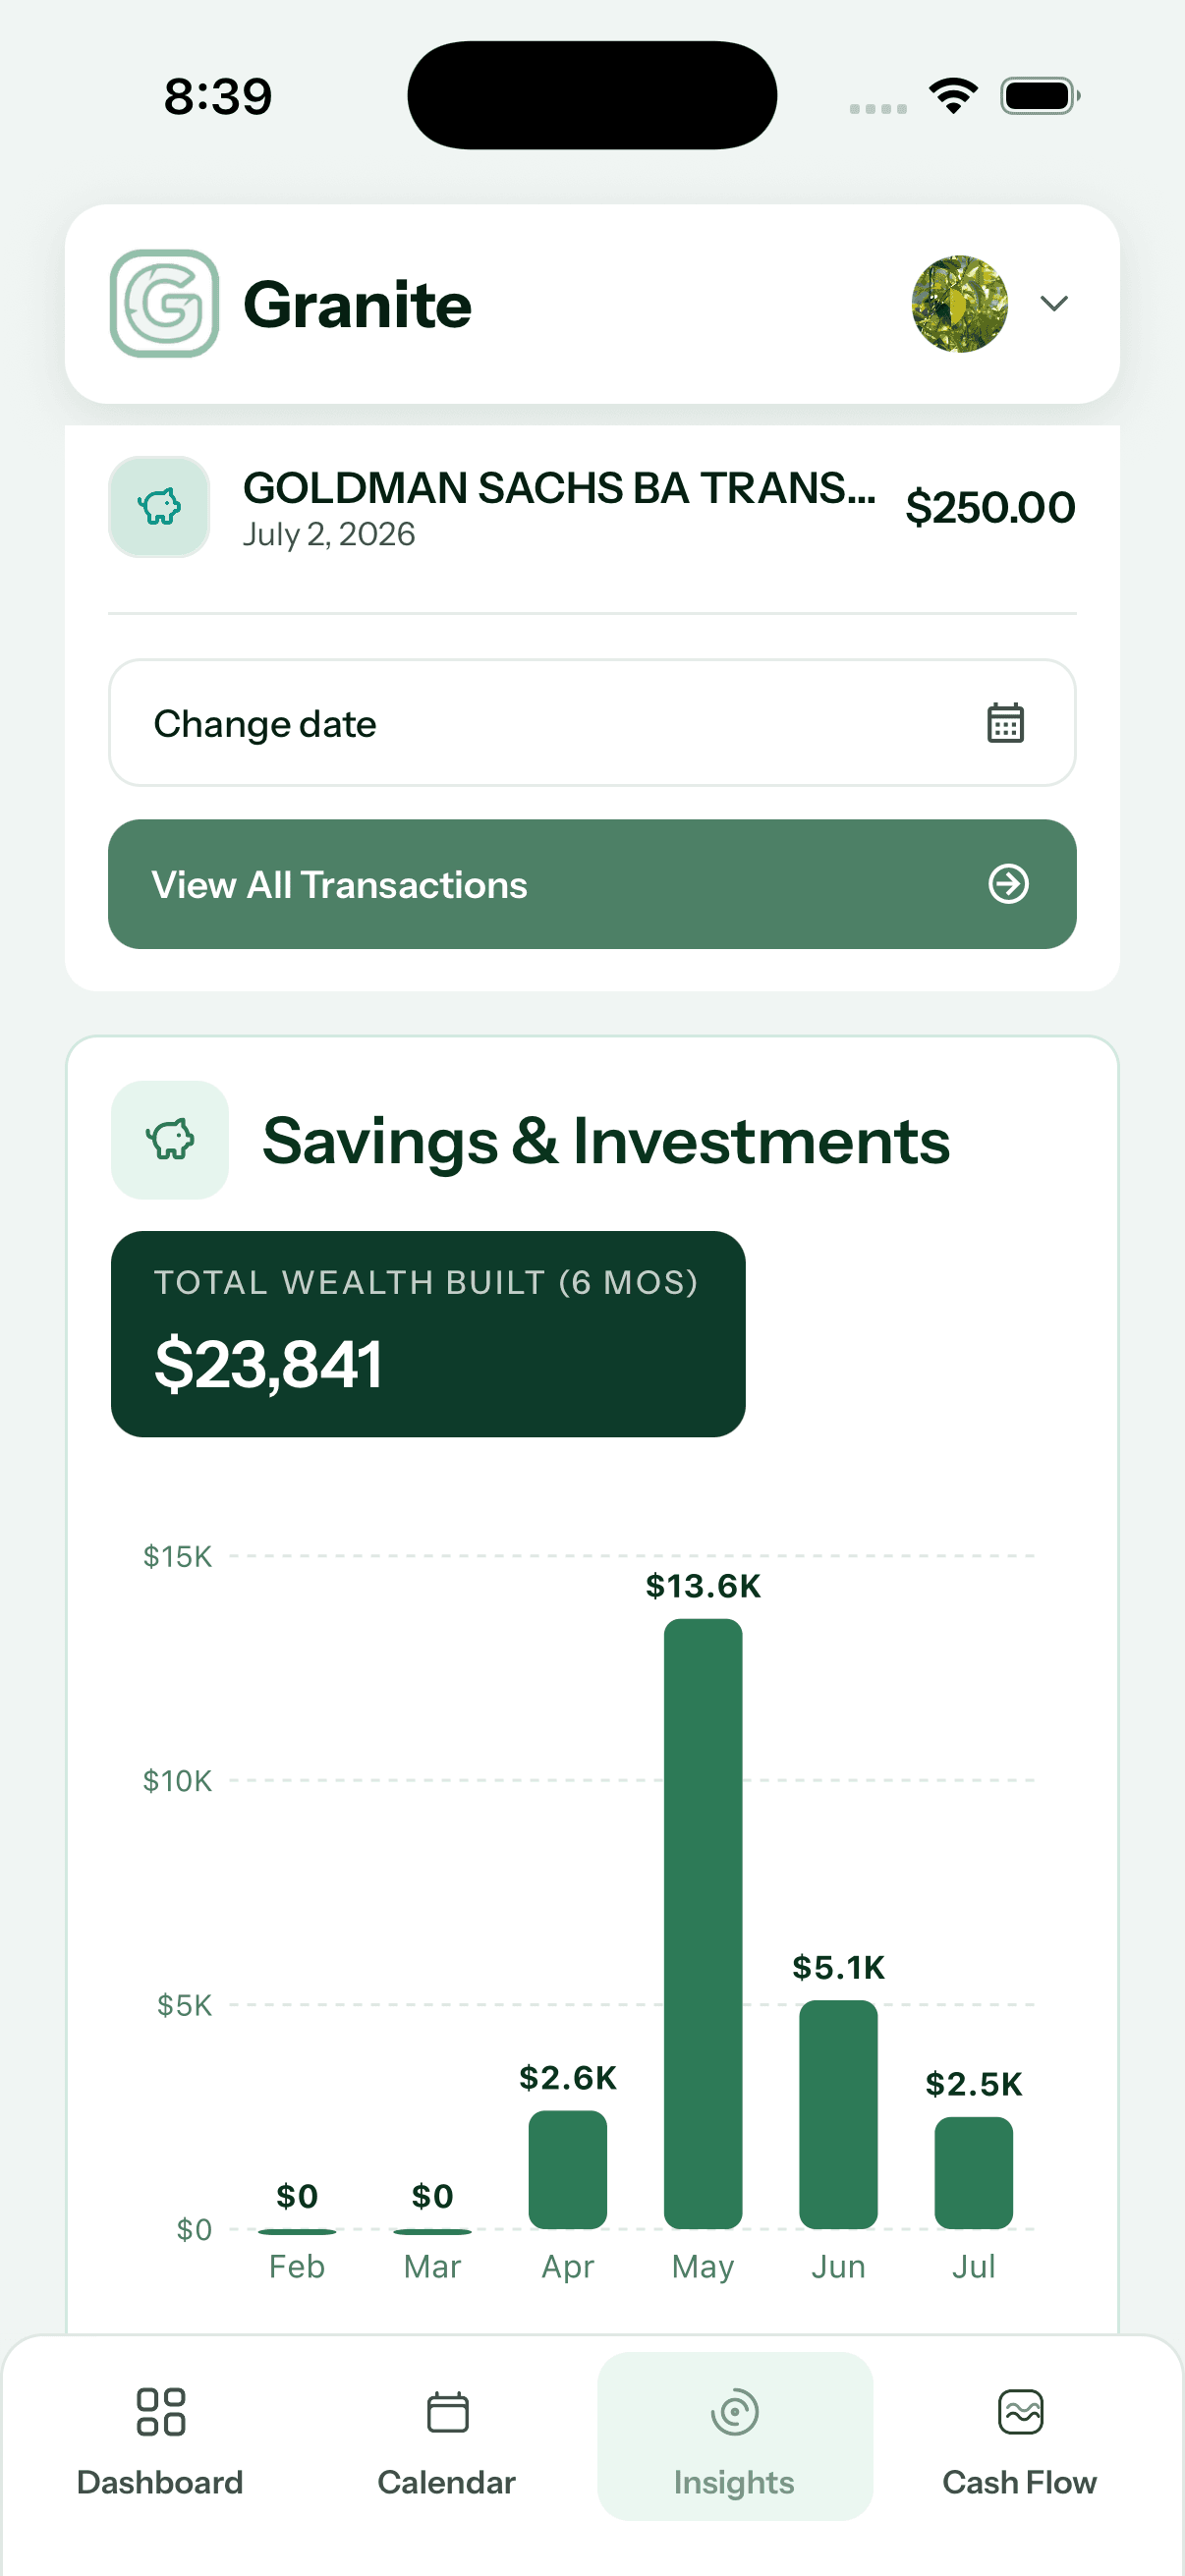
The Savings & Investments panel groups eligible activity assigned to savings and investment categories across a rolling six-month window. Its total shows the wealth-building activity Granite can identify during that period.
Select a bar to review the underlying records. If a contribution is absent, check its category and whether the relevant account or transaction is available to Granite. A target in your financial plan and an actual contribution are related but distinct: one expresses your intention, while the other records activity.
Why two Insight totals may not match
- The panels may use different periods: selected month, custom snapshot range, or rolling six months
- Category spending focuses on variable daily spending, while a broader expense view can include recurring bills and subscriptions
- Savings and investment activity is separated from ordinary expenses in supported views
- A transaction edit can change the effective amount, merchant, or category used by supported calculations
- A pending transaction can change when the financial institution posts the final record
- A newly connected account may not yet have supplied enough history for a complete comparison
What AI does—and does not—control
The figures on the current Insights page are calculated from the transactions, recurring matches, categories, and customer edits available to Granite. They are not invented by an AI model.
An AI assistant may help explain financial information in another Granite experience, subject to that experience’s permissions and available data. An explanation does not silently change the transactions or calculations behind these Insights. Review the underlying records whenever a summary surprises you.
If an Insight does not look right
If the underlying records look right but a total still does not, contact Granite with the panel name, displayed date range, and the result you expected. Never include passwords, verification codes, or full account numbers.
- Confirm the date range or selected month shown on the panel
- Select the relevant bar, category, or expense to inspect its transactions
- Check recent edits to transaction amounts, categories, and merchant names
- Review recurring matches if a bill or income item appears in an unexpected group
- Compare pending activity with the final posted amount
- Confirm the account containing the missing activity is connected and current
Continue learning
Keep building the full picture
Getting started
What is Granite Finance?
Learn how Granite turns your financial plan and connected-account activity into a daily budget, cash-flow context, and clearer spending decisions.
Guides
How transactions affect your Granite budget
Understand how purchases, income, pending activity, manual entries, edits, categories, and ignored transactions change what remains available.
Guides
How to read Granite’s 30-day cash-flow forecast
Understand current checking, projected low points, expected deposits and bills, credit-card due dates, and why a new forecast needs history.
Guides
How to search and filter transactions in Granite
Find the activity you need by merchant, category, account, date, amount, or transaction status.
Guides
How to update income, savings, and investments in Granite
Keep the monthly income, savings, and investment amounts behind your Granite budget aligned with your real financial plan.